I was reading
Matt Bai's most recent post on the presidential campaign; not as good as his usual missives, but still basically entertaining (and informative I didn't realize he was white; I guess I assumed Bai as an Asain name). But I focused mainly on
a graphic that the New York Times placed in a sidebar showing the percentage of Americans who believe that a woman will be elected president during their lifetimes. Another statistical graphic without any exegesis; when will the Times learn? Based on the main gist of the article, I suppose we are to conclude that younger people are more open to the idea of a female president, and, therefore, more likely to conclude that a woman will be elected. Of the under-45 voters who expressed an opinion (95%), 17% believed that a woman would not be elected in their lifetimes. On the other hand, of the over-65 voters with an opinion (83%), 47% believed that no woman would be elected while they lived.
But the young have something more important than open-mindedness that accounts for the statistical difference: life expectancy. Simply put, the under 45 voting crowd will witness many more elections, and, therefore many more chances of electing a female president. Let's plot this out. Given a probability
X of a woman being elected in any election, the probability that a woman would NOT be elected after
N elections (or 4
N years) is:
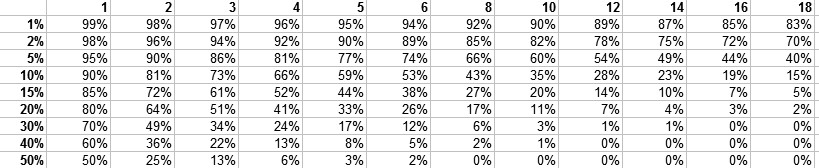
(1-X)^NThe following chart gives the probability that a woman would not be elected given various values for X (left column) and N (top row):

Let's say that an "Under 45 voter" is 35 (a mean of 18-45 weighed toward the fact that younger people vote in lower percentages) and let's call an "Over 65 voter" 70 years old. It's obvious that a woman will not be elected president this year, so we'll say that the 70 year olds have, on average 3.5 more elections in their lifetime where a woman could be elected (I'm giving a them more longevity than you'd expect since there is some probability that McCain will be elected and die in his first term, giving a Mrs. President Palin. Though this poll was taken in June, after Hillary had dropped out but before McCain's choice of a female VP seemed likely). The 35-year-old voter has, on average, 10 more elections (I'm giving them a few fewer years on average to live because a 35 year old hasn't proved they won't die before 70). And we'll define "likely to become president" the standard way: over 50% chance. That is, if the voter thinking that it was likely had to bet with even odds, he or she would bet for a woman president being elected.
What can we extrapolate from the chart and formula? If a (rational) 35-year-old voter said that he thought it likely for a woman to be elected, he would need to believe that a woman has over a 7% chance of being elected in any given election, while a 70-year-old voter needs to believe that there's an 18% chance of a woman being elected.
A quick-and-dirty way of extrapolating from the results of the poll to the table is to say if 25% of people believe X is likely, we should look at the point in the table where X is 25% likely to happen. (There are better ways depending on what distribution of beliefs you think voters have, but this should work well enough for now). So since 47% of over-65 voters don't believe a woman will be elected in the next 3.5 elections, we can suppose that they believe women have a 20% chance of being elected any given election.
What about the younger crowds? 17% of the under-45 crowd believe that after the next 10 elections we still won't have a woman president. That works out to belief in a 16% chance of a woman being elected president any given election. So if anything, the young are less optimistic of women's chances of breaking that ultimate glass ceiling than older voters are.
What CBS (the poll takers) should have done is removed a variable by asking, "Do you think it is likely that a woman will be elected president in the next 30 years?" so that all their respondents were thinking along the same time frame. The woman vs. men answer (an apparent +5% optimism gap toward women) is similarly skewed by age and probably underestimates women's optimism about the topic. Since women live longer, they probably disproportionately make up the (more optimistic) over-65 audience. In fact, we may be able to explain the entire age difference in this response by the gender differences and women's propensity to live longer.
(I realize now that I have used the word "optimism" throughout this article, assuming, dear readers, that like me you'd view the possibility of a female president as a good thing. If for some reason you disagree, please comment with your reasons. Oh and the graphic's title should have been
Madam President. No one said that the female president needed to be married.)